
FP Markets
@t_FP Markets

What symbols does the trader recommend buying?
Purchase History
پیام های تریدر
Filter
FP Markets
شکست یا سقوط انویدیا (NVDA): کدام مسیر در انتظار سهام است؟
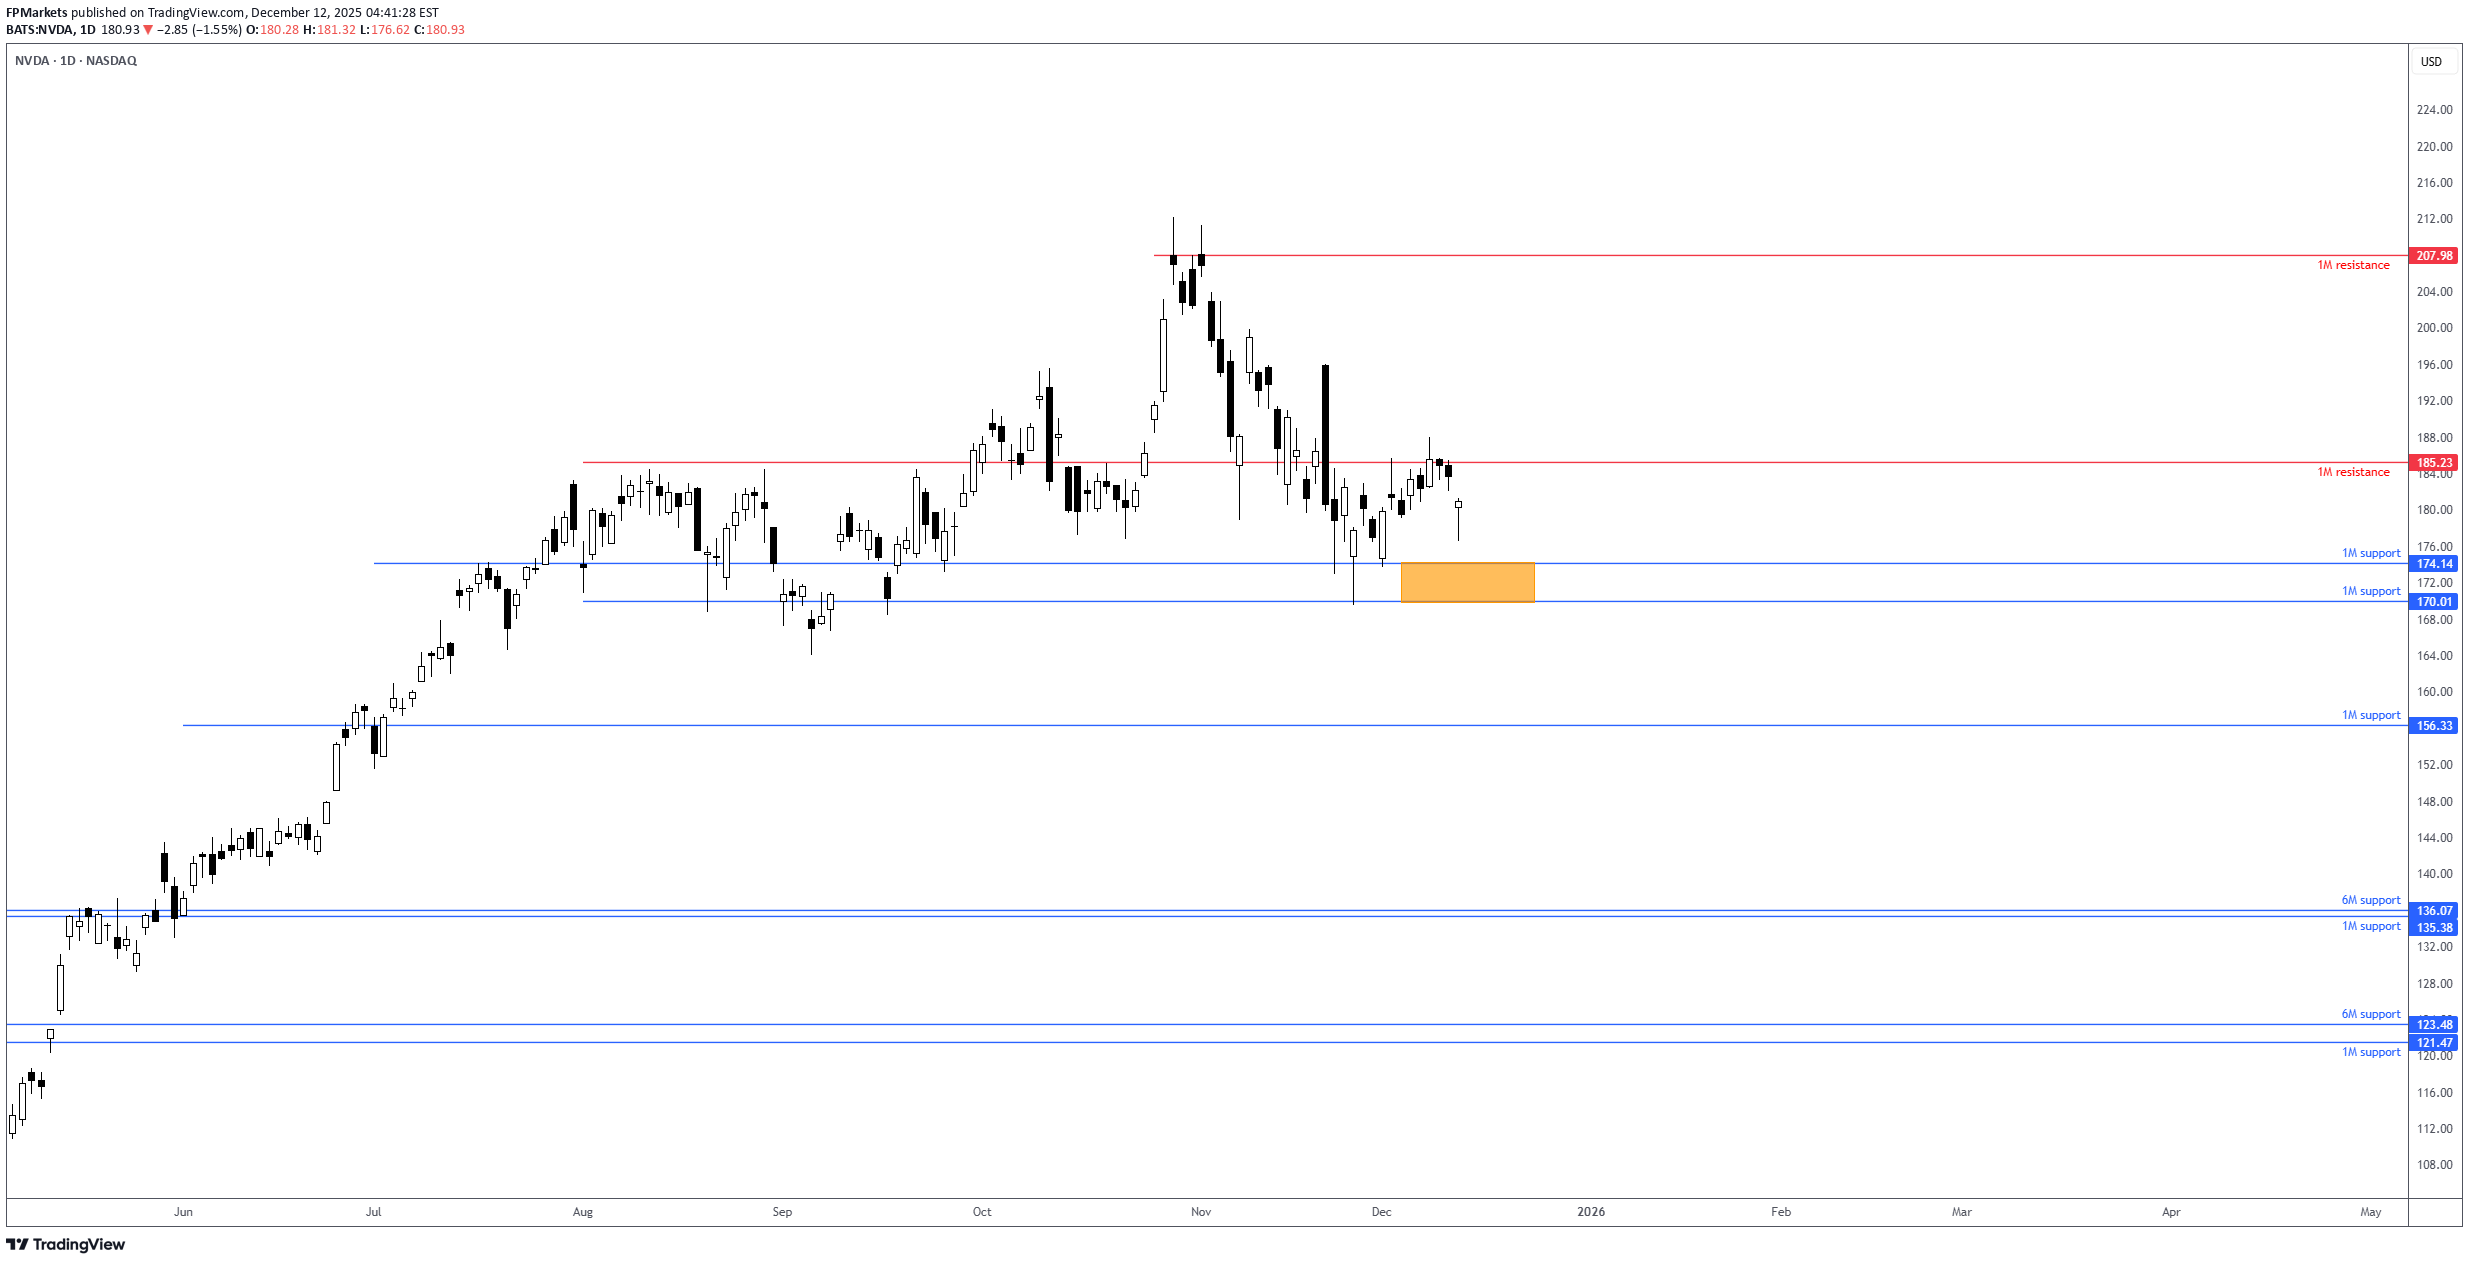
Shares of Nvidia took a hit during Thursday’s session, losing about 1.5%. Technically, the trend remains northbound, though near-term price action has shown a few lower lows and lower highs: early signs of a downtrend. 1M resistance recently made a show at US$185.23 and withstood a few upside attempts. 1M support is nearby between US$170.01 and US$174.14, with a break under here unbolting the door to another layer of 1M support from US$156.33. Alternatively, pushing above US$185.23 would help bolster the long-term trend, and potentially attract fresh buying to 1M resistance at US$207.98, closely shadowed by the all-time high of US$212.19. Ultimately, the direction of travel for this Stock will depend on whether it breaks above resistance at US$185.23, encouraging buying, or below the support zone between US$170.01 and US$174.14, which could prompt further underperformance. Written by the FP Markets Research Team
FP Markets
بیت کوین زیر ۱۰۰ هزار دلار: آیا تله خریداران فعال شده است؟
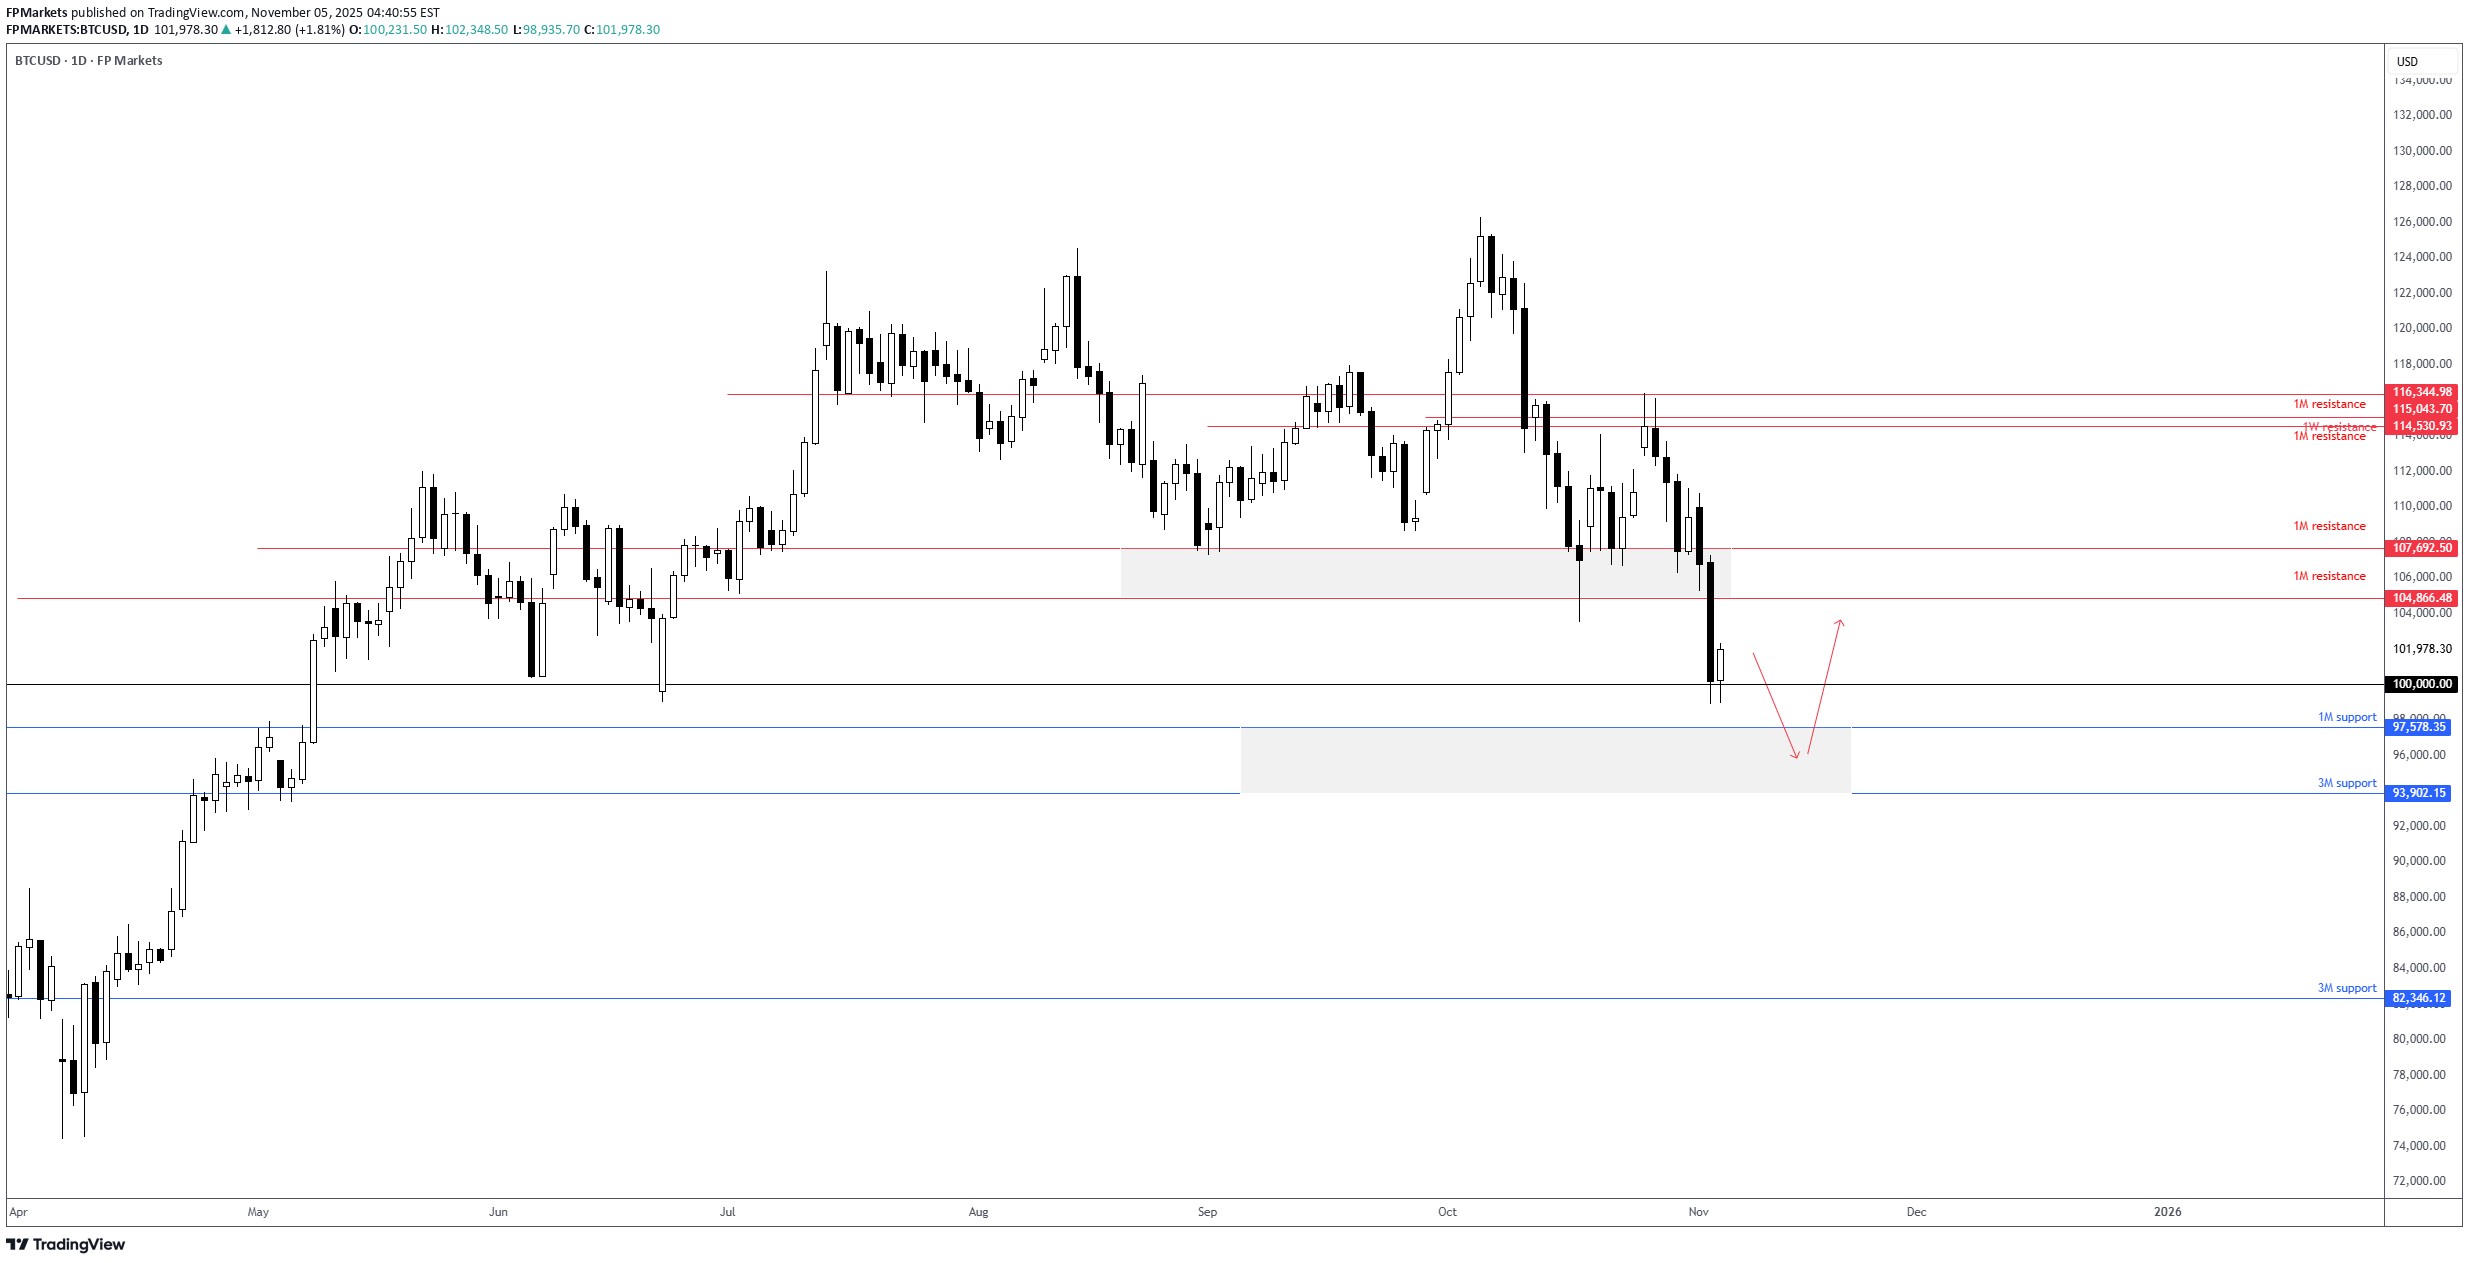
Touching back in on BTC/USD, you can see that recent price action briefly dipped beneath US$100,000, with buyers currently defending the big figure. However, with November down 7.0%, and following the major Cryptocurrency pair trading under key support between US$104,866 and US$107,692 (1M levels) – which is now set as resistance – a dip lower could still be on the table to support between US$93,902 (3M) and US$97,578 (1M). This could also set up a whipsaw scenario, where price snaps under US$100,000, filling stops under the big number, and then rebounds from nearby support at US$93,902-US$97,578, as per the red arrows. Written by the FP Markets Research Team
FP Markets
احتمال سقوط بیشتر اتریوم (ETH/USD): سطوح کلیدی حمایت و مقاومت!
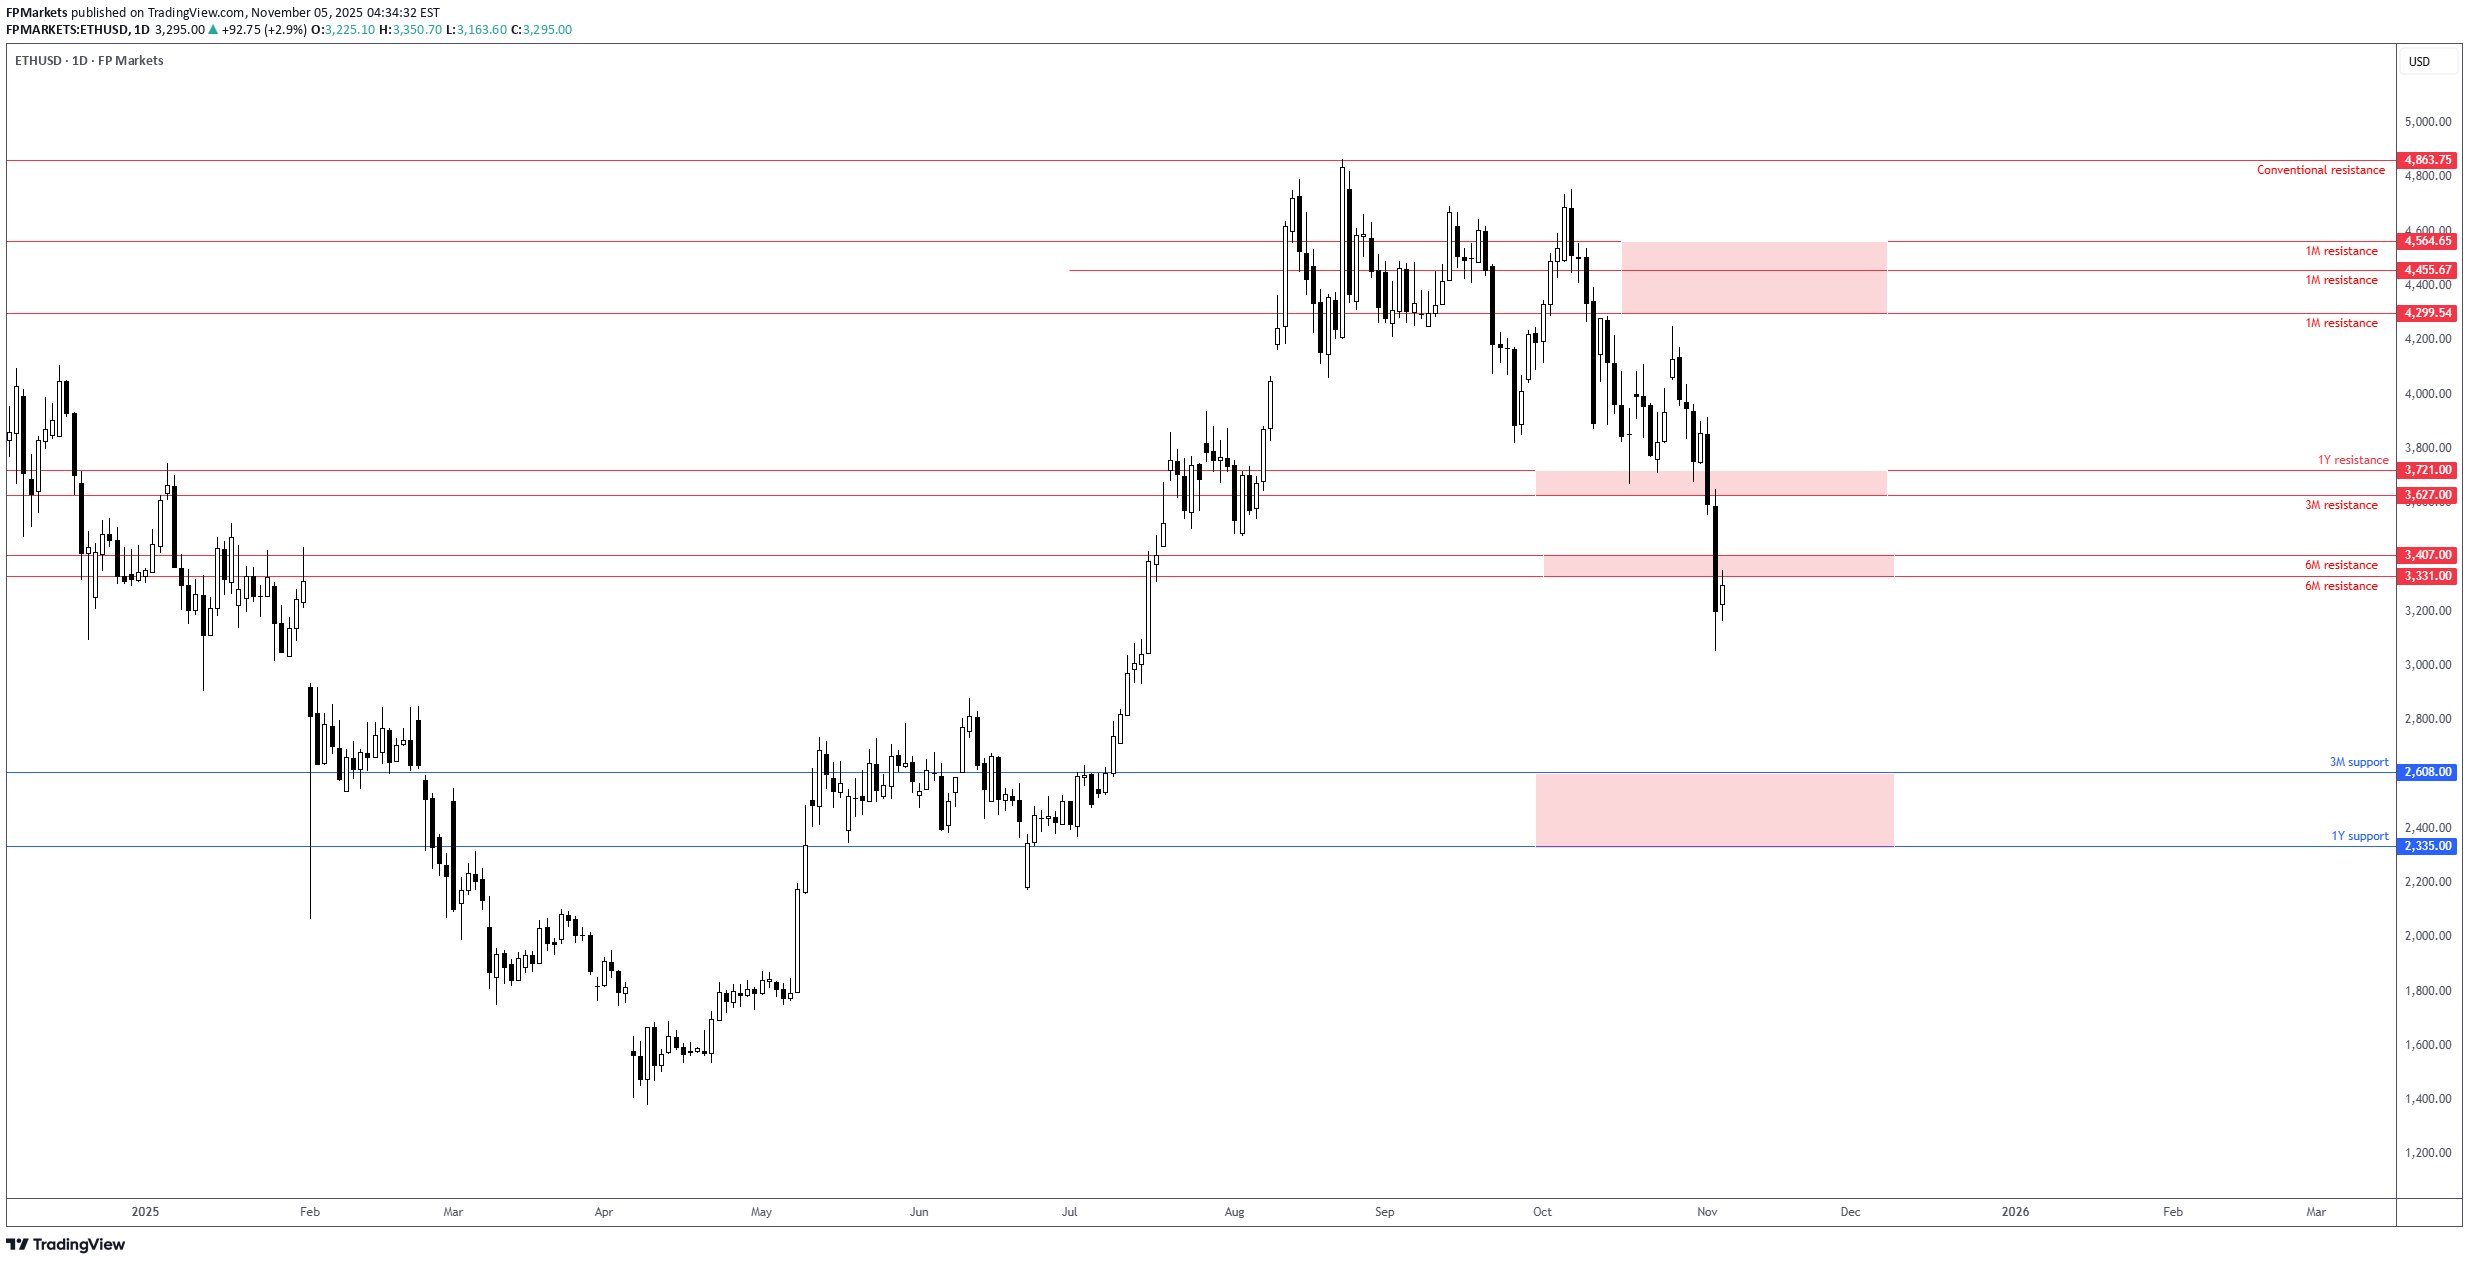
Following an 8.0% loss in October, ETH/USD has declined nearly 15% this month, and technically speaking, the pendulum is swinging towards further selling in the major altcoin. As shown in the chart below, the pair recently absorbed bids at support between US$3,331 and US$3,407 (6M levels) and is currently retesting the underside of said area as a potential resistance zone. Were sellers to successfully defend this area, this suggests bears could remain in the driving seat until support between US$2,335 (1Y) and US$2,608 (3M). Written by the FP Markets Research Team
FP Markets
بیت کوین در مسیر سقوط زیر ۱۰۰ هزار دلار؟ تحلیل عمیق حرکتهای کلیدی BTC/USD
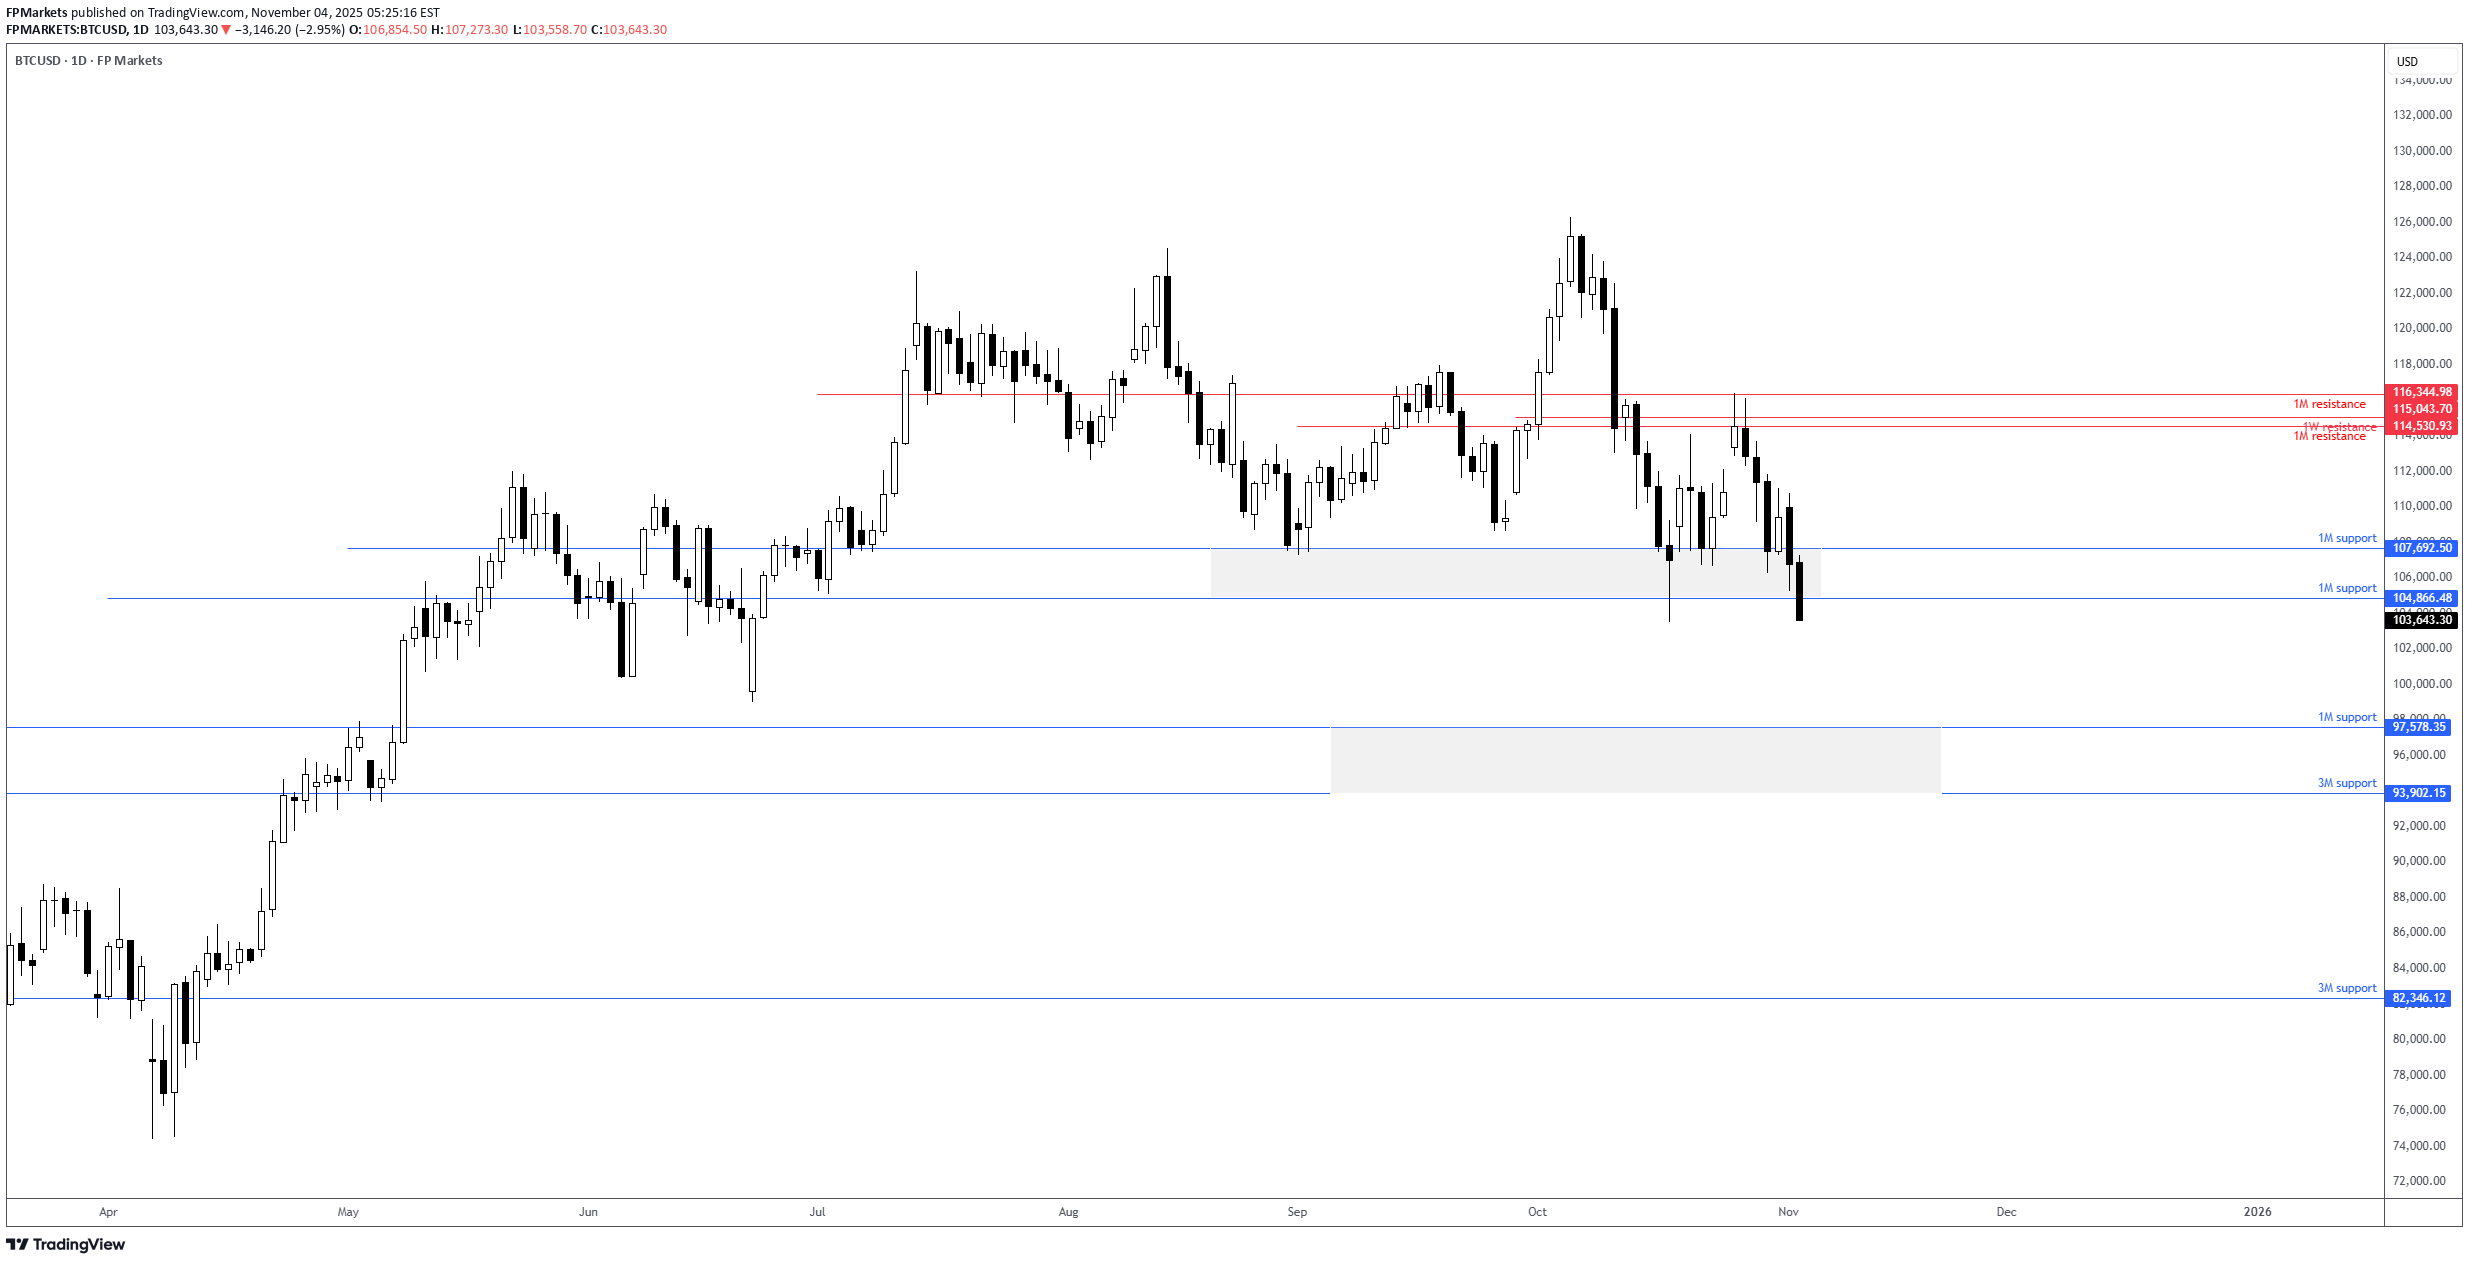
Following a 4.6% fall in October, November is already down by 5.2%, with today’s movement dipping a toe under key support between US$104,866 and US$107,692 (1M levels). This follows a rejection of resistance at US$116,344-US$114,530 (composed of 1M and 1W levels), and suggests the major cryptocurrency is headed back under US$100,000. Below US$104,866-US$107,692, which could serve as resistance soon, limited support is evident until between US$93,902 (3M) and US$97,578 (1M). Therefore, further bearish scenarios could soon unfold. Written by the FP Markets Research Team
FP Markets
نوسان شدید در انتظار قیمت اتریوم (ETH/USD)؟ سطوح کلیدی حمایت و مقاومت
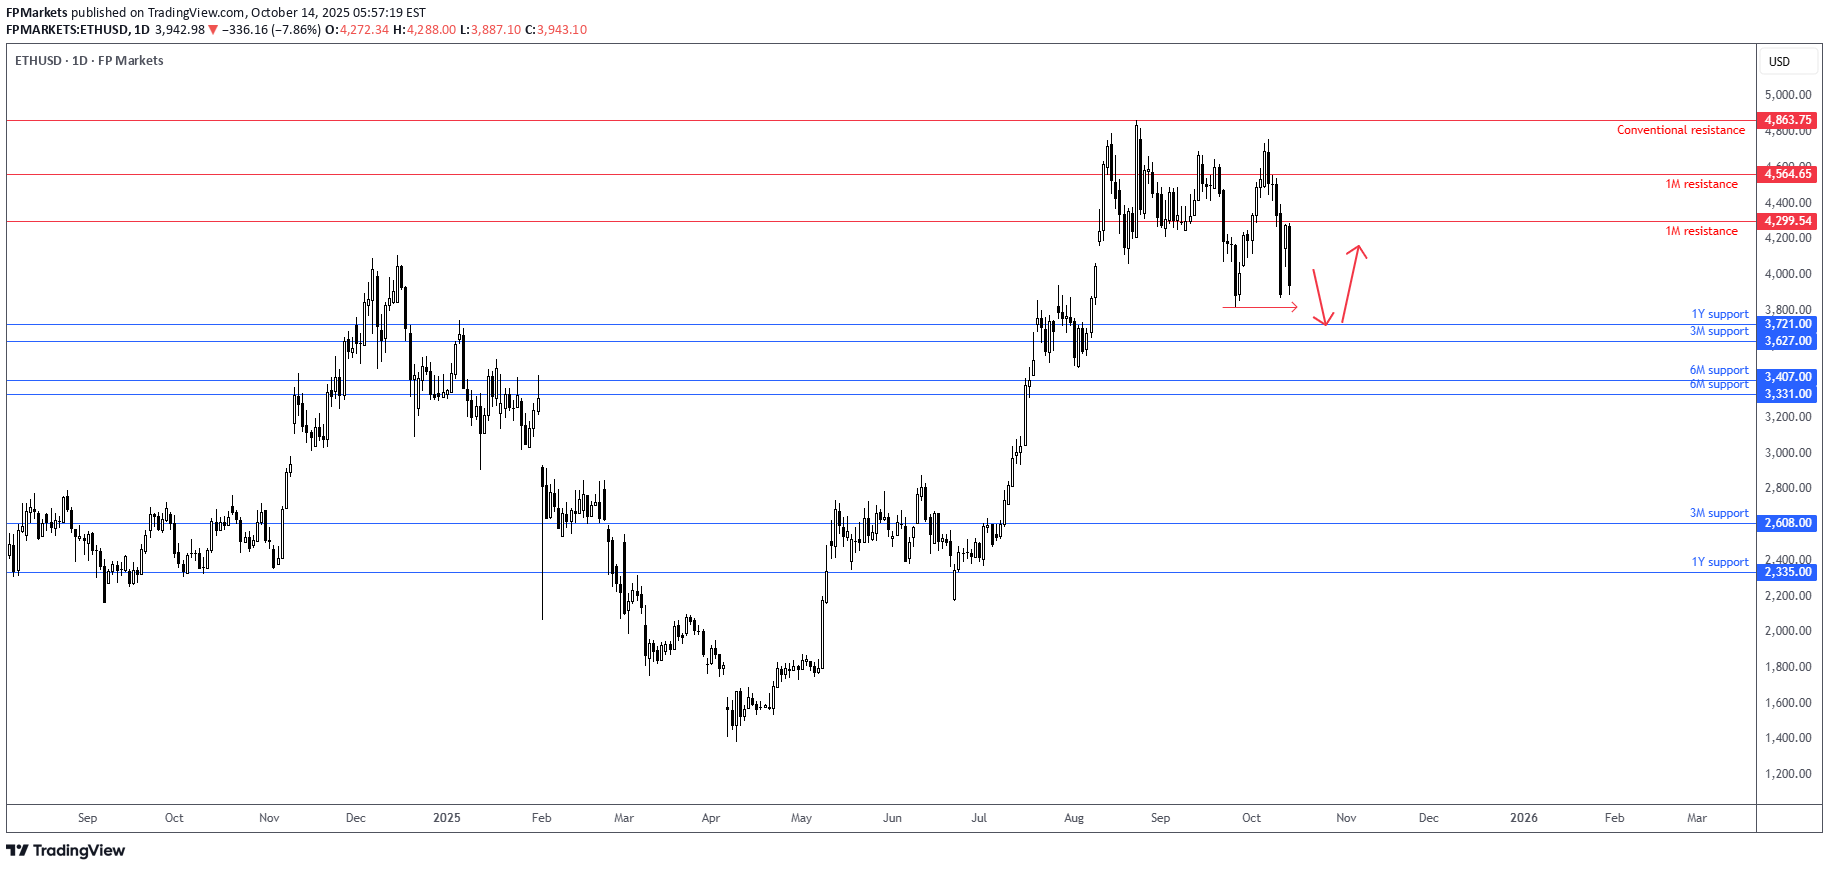
Price action on the ETH/USD is currently nursing losses just ahead of September lows of US$3,820, with support nearby at US$3,627-US$3,721 (this is made up of 3M and 1M levels). Given that this support is located just south of the noted September lows, a whipsaw play could be observed (see red arrows). Additional levels of support and resistance to have noted include support between US$3,331 and US$3,407 (6M levels), with resistance posted above current price at US$4,299 and US$4,564 (1M levels). Written by the FP Markets Research Team
FP Markets
ETH/USD eyeing H&S top profit objective!
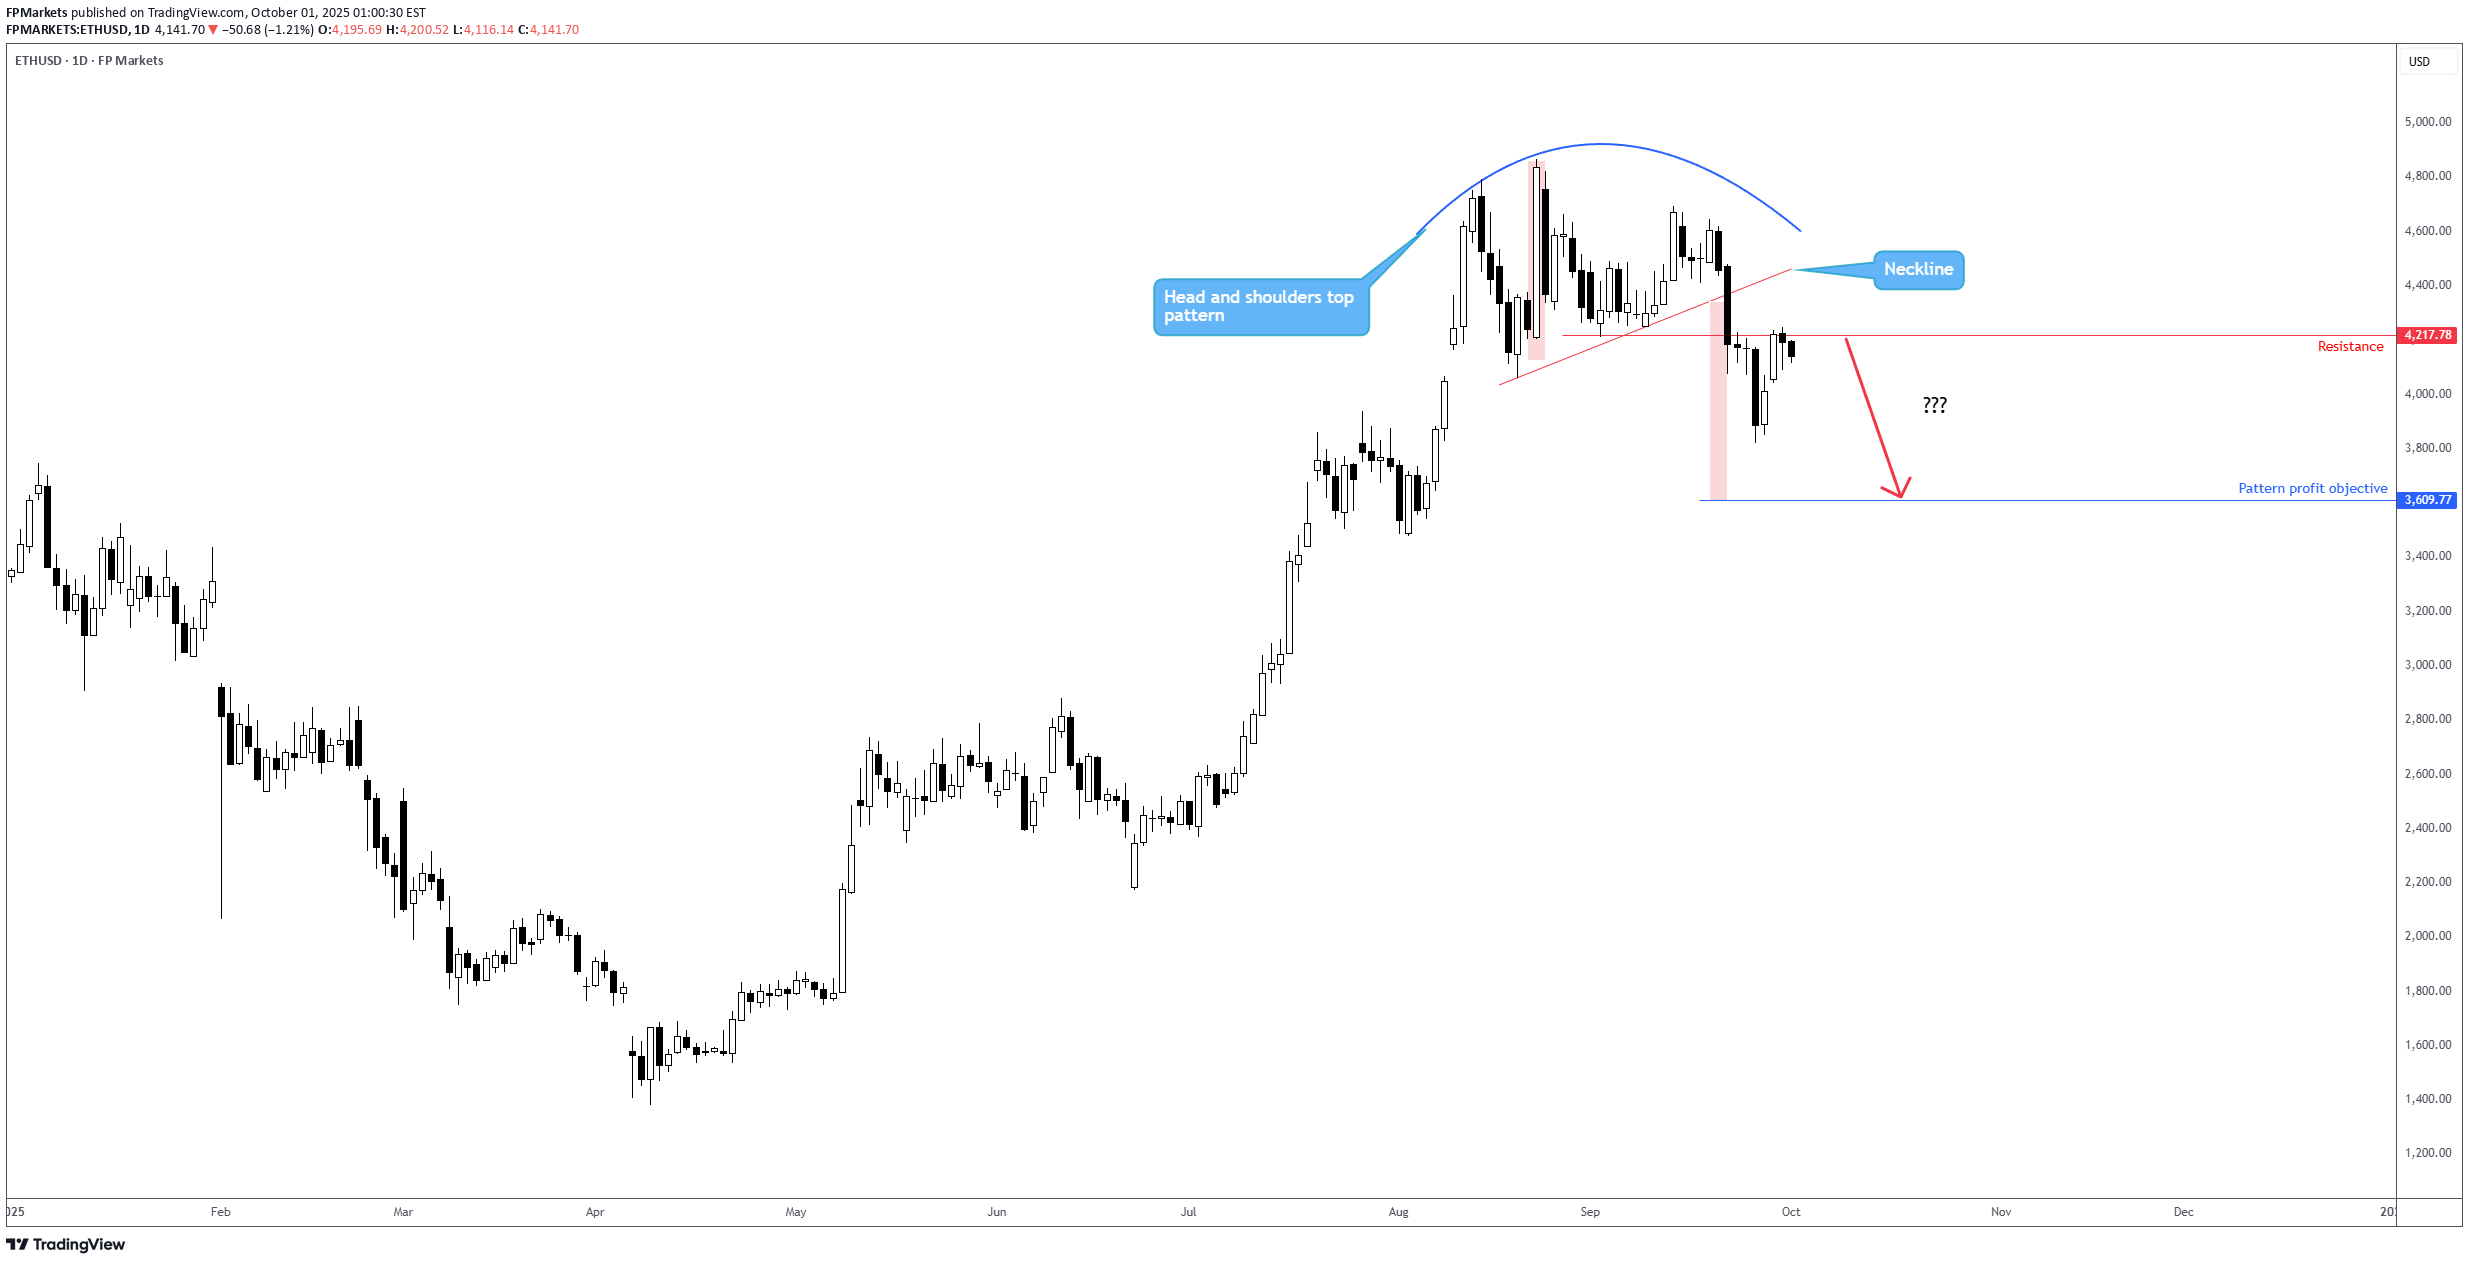
From the daily price of ETH/USD (Ethereum versus the US dollar), price recently engulfed the neckline of a head and shoulders top pattern (extended from the low of US$4,060). Subsequently, it retested the underside of resistance at US$4,217. Should the unit hold resistance, further selling towards the head and shoulders pattern profit objective at US$3,609 could be seen. FP Markets Research Team
FP Markets
Follow-through buying on TSLA?
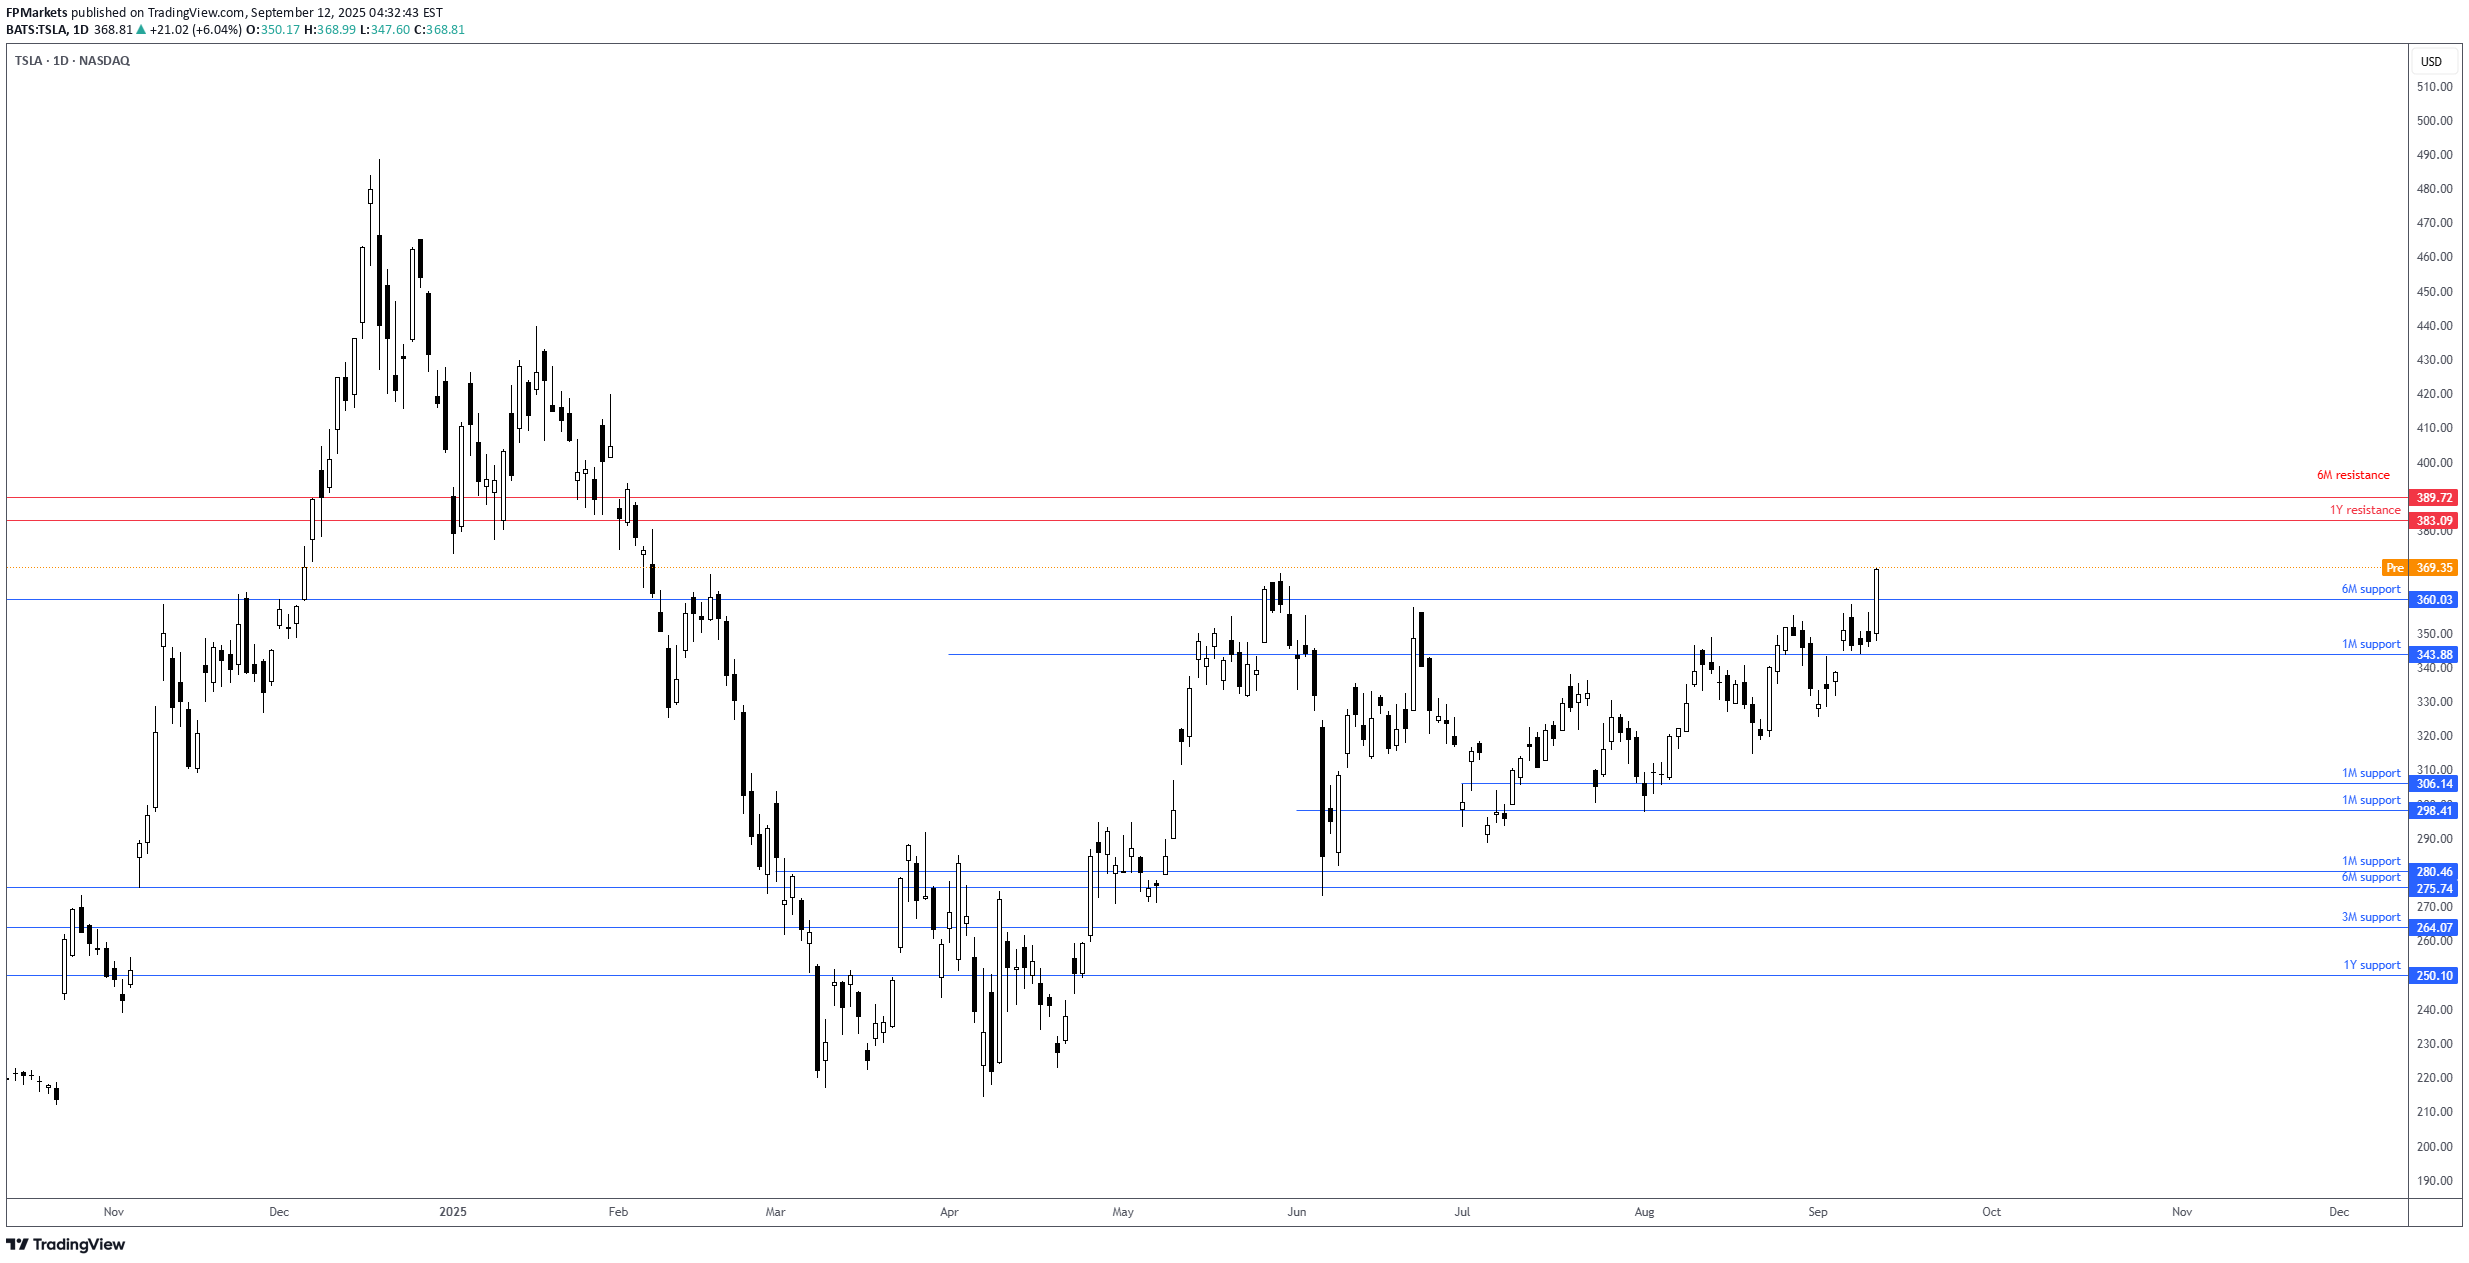
Following a one-sided 6.0% gain in Tesla’s share price on Thursday, this helped lift the S&P 500 and Nasdaq to fresh records. As shown in the chart below, the TSLA Stock rallied through a 6M resistance level of US$360.03 to a high of US$368.99, levels which have not been seen since earlier this year. Further buying could now be seen for the Stock towards the resistance between US$389.72 and US$383.09. However, before reaching said area, a pullback may occur, retesting US$360.03 as support, with a dip into 1M support from US$343.88 possible. Written by the FP Markets Research Team
FP Markets
SOL/USD to reject resistance?
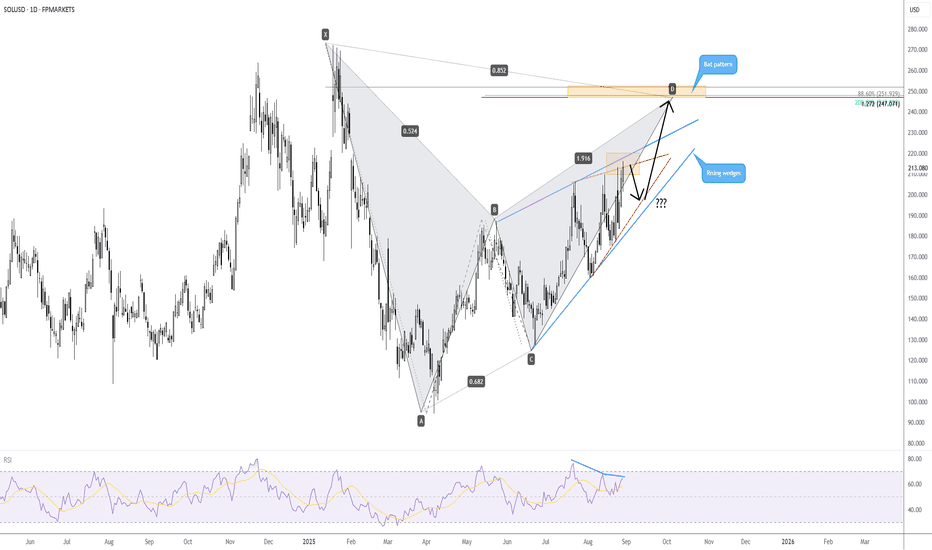
An interesting technical scenario is brewing on SOL/USD (Solana versus the US dollar) at the moment. First and foremost, you will note that upside momentum has slowed; this is demonstrated by price action compressing between converging lines, offering two rising wedge patterns to work with (the larger formation is formed between US$127.48 and US$187.30; the smaller pattern is drawn between US$160.78 and US$206.10). With price now testing the upper boundaries of the noted rising wedge patterns and the Relative Strength Index showing negative divergence, this could prompt a bout of profit-taking and force a modest correction. Why I say a modest correction is simply because the larger harmonic bat pattern is in the process of forming its D leg. This could see the pair rally higher before connecting with the bat pattern’s Potential Reversal Zone (PRZ) between US$251.93 and US$247.07. Written by FP Markets Chief Market Analyst Aaron Hill
FP Markets
ETHUSD on track to challenge ATHs!
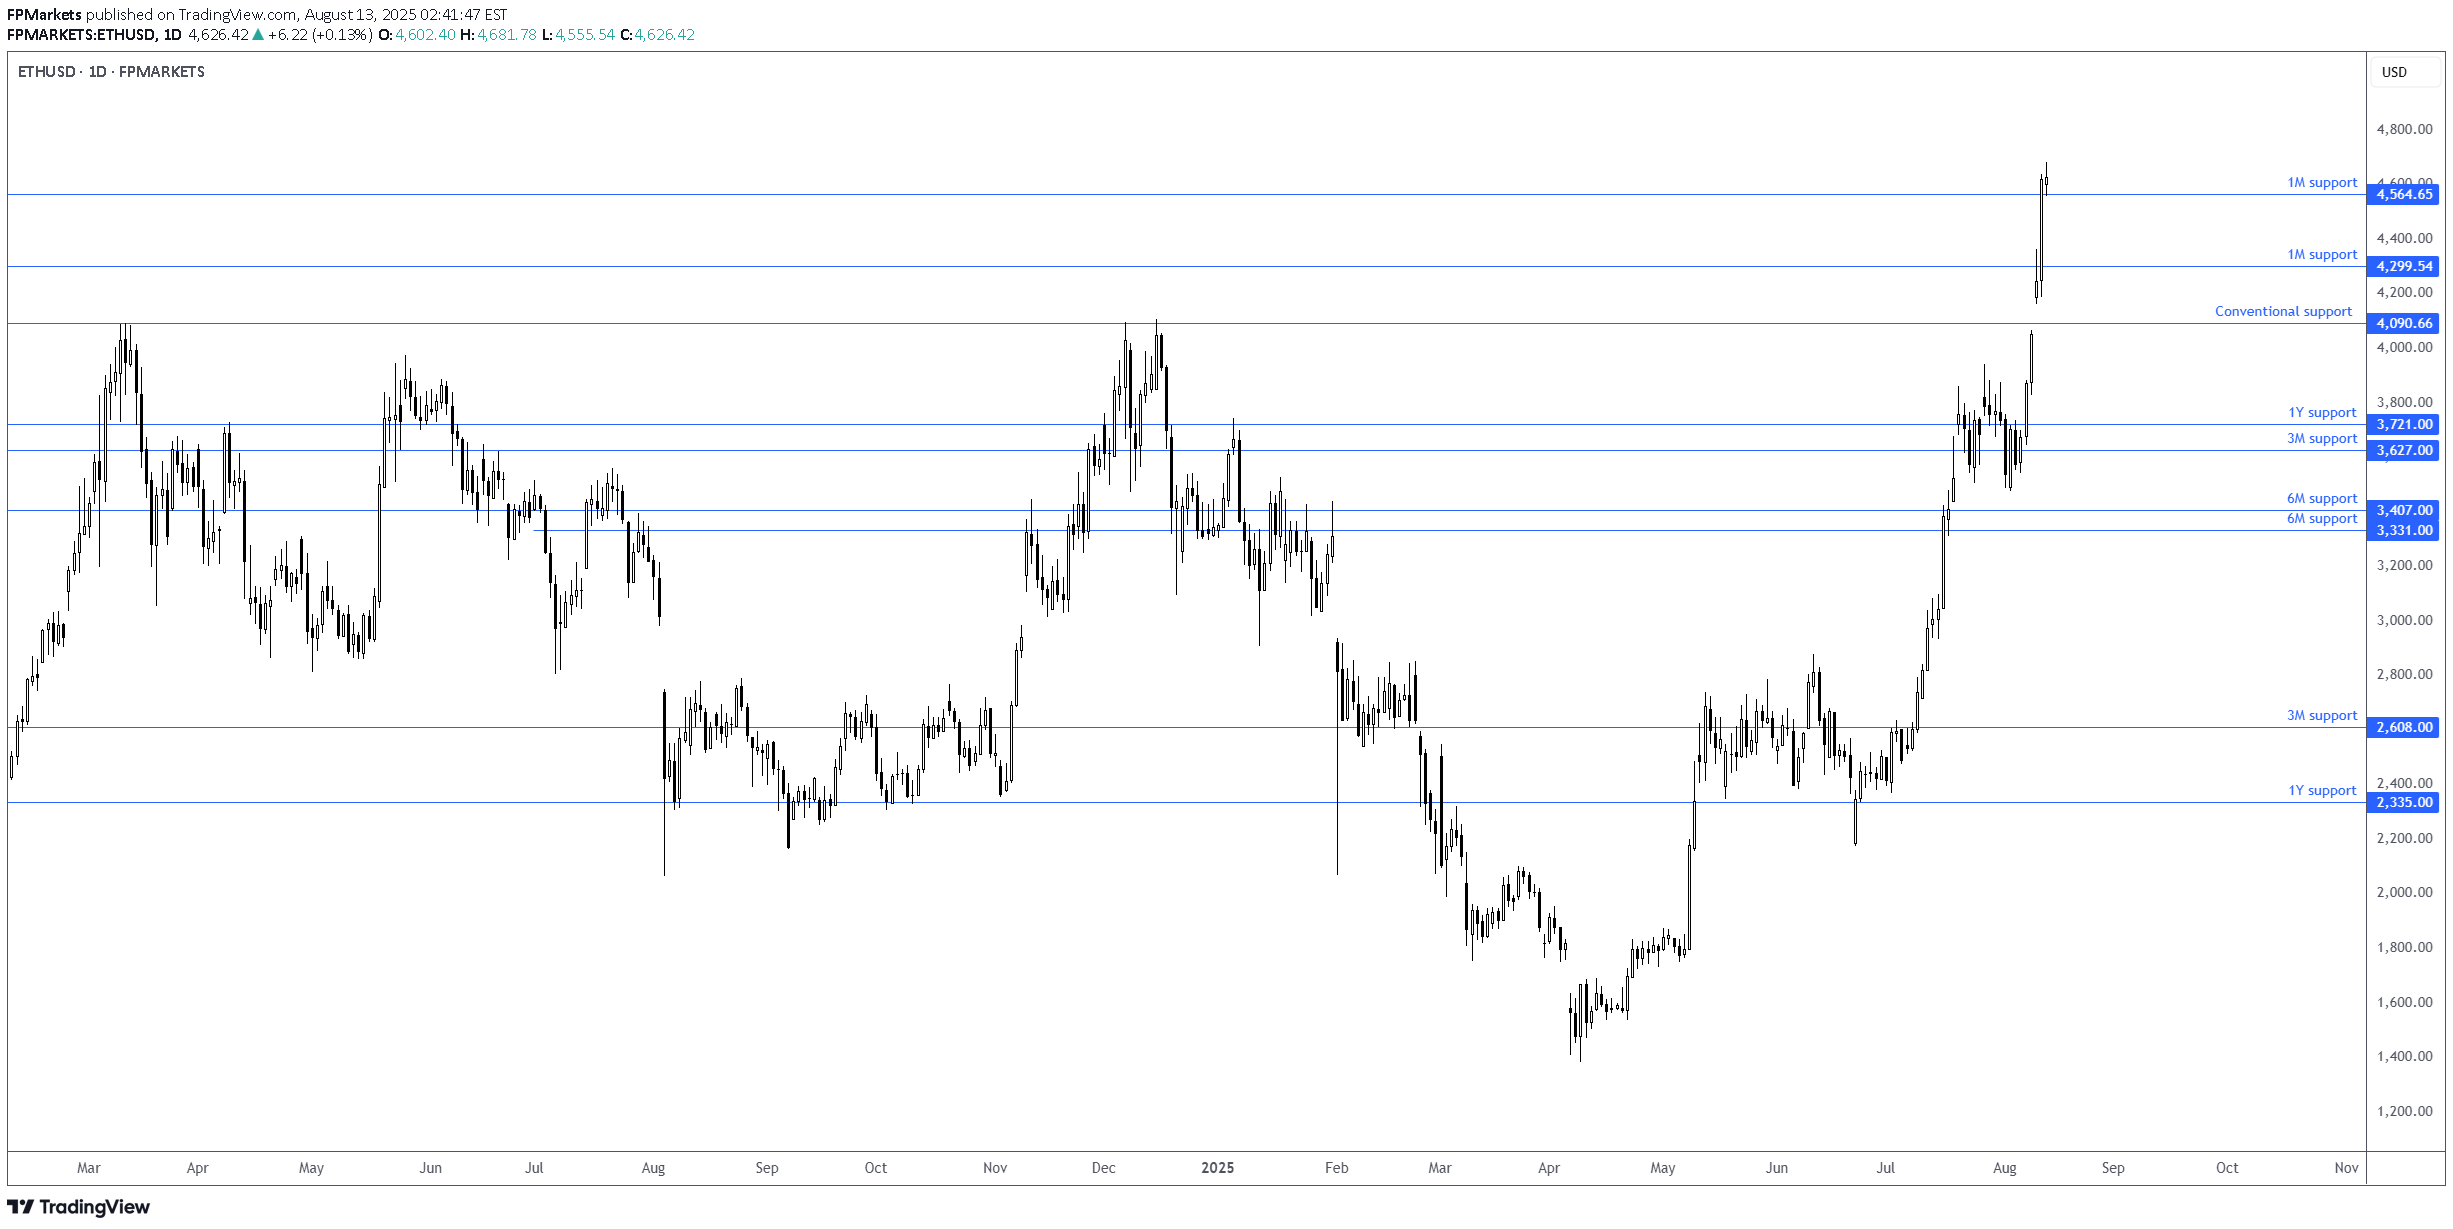
The ETH/USD pair has experienced solid gains over the past few days, breaking through several resistance levels and adding 14.0% so far this week! Having noted that price took out the 1M resistance at US$4,299 and US$4,564, there is very little technical ceiling in this market right now, and the next upside hurdle can be found at all-time highs of US$4,863. Given that today’s price action retested US$4,564, potentially forming support, this could provide enough technical fuel for buyers to pyramid their positions and target US$4,863. Written by the FP Markets Research Team
FP Markets
S&P 500 consolidating at all-time highs
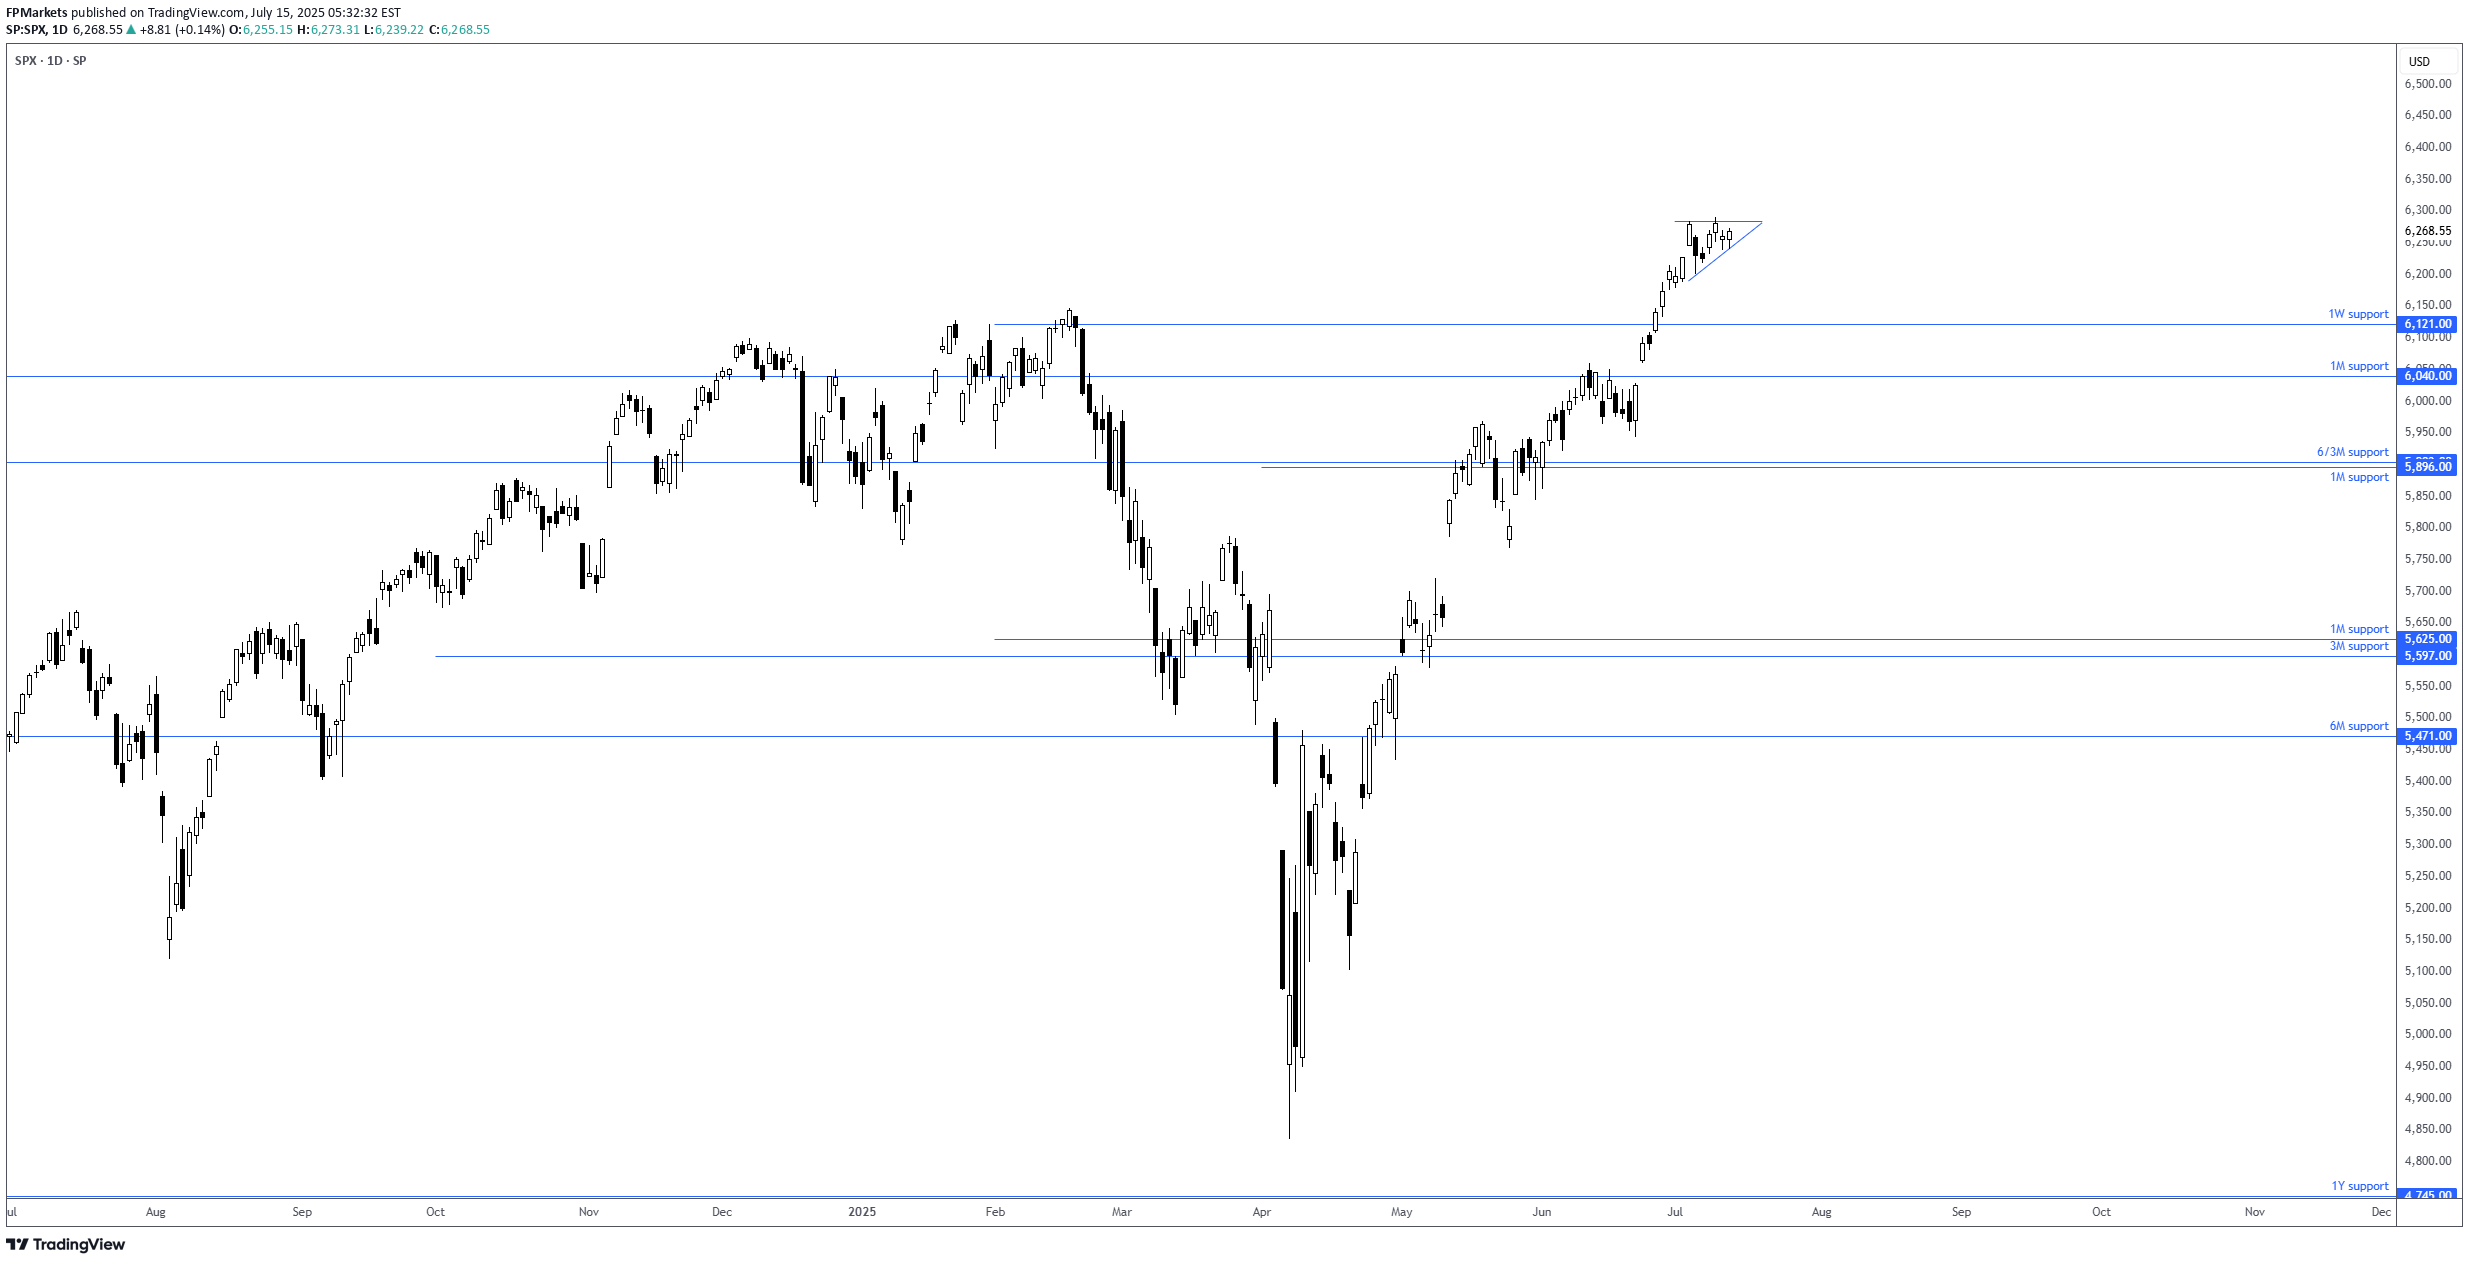
Of late, we have seen price action on the S&P 500 consolidate around all-time highs of 6,290 and is on track to form a small ascending triangle. The nearest support to note resides at the 1W level of 6,121, closely shadowed by a 1M support from 6,040. Based on the current technical picture, this clearly remains a buyers’ market. - FP Markets Research TeamThe team recently looked at the S&P 500 and highlighted that the major Stock market Index hit fresh all-time highs of 6,302. We also noted a possible ascending triangle forming around said highs, which, as you can see, experienced an initial fakeout to the upside on Tuesday, followed by a fakeout to the downside yesterday. While recent price action invalidates the pattern, it does show that buyers are strong at this level, following the sizeable lower candle wick yesterday.
Disclaimer
Any content and materials included in Sahmeto's website and official communication channels are a compilation of personal opinions and analyses and are not binding. They do not constitute any recommendation for buying, selling, entering or exiting the stock market and cryptocurrency market. Also, all news and analyses included in the website and channels are merely republished information from official and unofficial domestic and foreign sources, and it is obvious that users of the said content are responsible for following up and ensuring the authenticity and accuracy of the materials. Therefore, while disclaiming responsibility, it is declared that the responsibility for any decision-making, action, and potential profit and loss in the capital market and cryptocurrency market lies with the trader.